Get To Know About Profiler In SQL Server

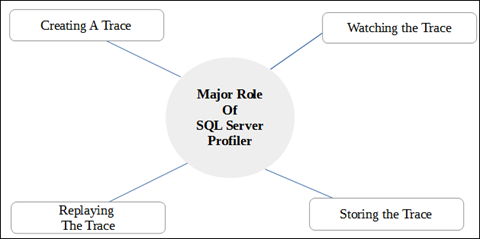
SQL server comprises of an inbuilt powerful tool i.e., SQL Server Profiler. This feature or tool is embedded with the server since a long time and is generally used by database administrators. It render various important functions like examining what is operating under SQL server Engine’s hood, determining the ways by which queries were fixed, what T-SQL scripts are running for accomplishing tasks, etc.
The trace involves all the T-SQL scripts, which are running simultaneously on the server. Since the trace comprises of all the T-SQL server scripts, it tends to become substantially large. Therefore, it is recommended to server users that they should capture only those data file that is required for analysis.
Additional Information About SQL Server Profiler
Basically, SQL Server profiler is a utility, which execute on the server in order to monitor and log specified activities for producing an activity list occurring on the server. With help of this SQL server profiler, users can capture only the event that they want to examine. It will create a customizable view of the event (which is to be monitored) for server user.
Until now in this blog, we are continuously seeing a term ‘trace’ but now a question arises ‘What exactly a trace is?’
A trace catches a data which is related to a selected event classes, data columns, and filters. One should select only those trace where data columns are essential for analysis. This trace can be stored either within the database or in the trace files.
NOTE: Event classes are basically an event type, which can be traced and filter is an option for creating a particular data that is to be gathered in trace.
Learn How to Work With SQL Server Profiler
Launching the Server Profiler Window
-
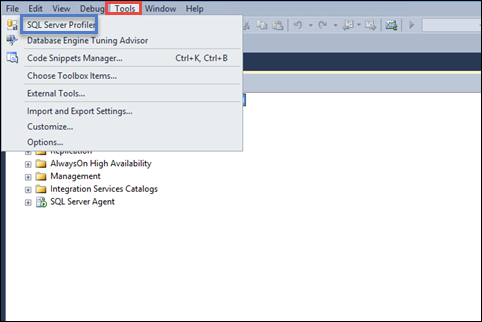
- With Help of Management Studio
To launch profiler window from Microsoft SQL server management studio, you will have to navigate to Tools >> SQL Server Profiler
-
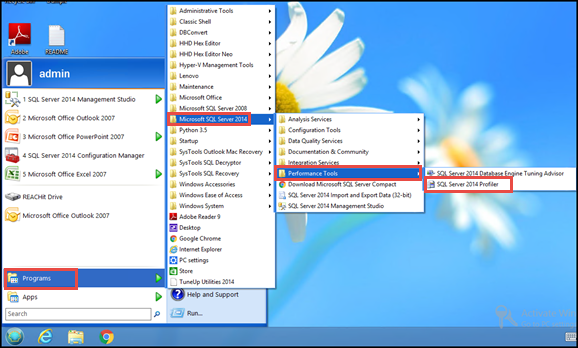
- Directly From Windows OS
Navigate towards Start button of Windows on your machine and then go to Programs >> Microsoft SQL Server >> Performance Tools >> SQL Server Profiler
-
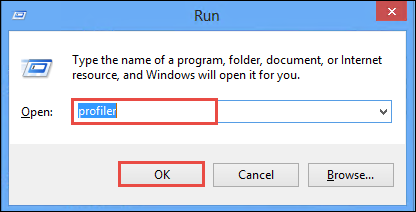
- With Help of Command Prompt
Open Run window on your operating system and run the following command for SQL server 2008 and all latest server versions, in order to launch profiler in SQL Server window
profiler
Launch the Run window on your machine and run the following command for SQL server 2005 for opening SQL server profiler
profiler90
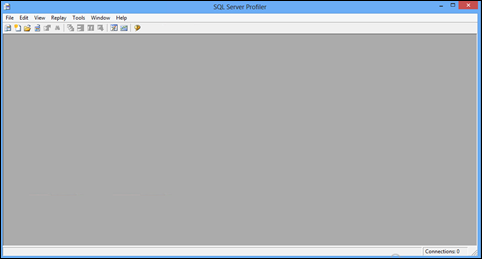
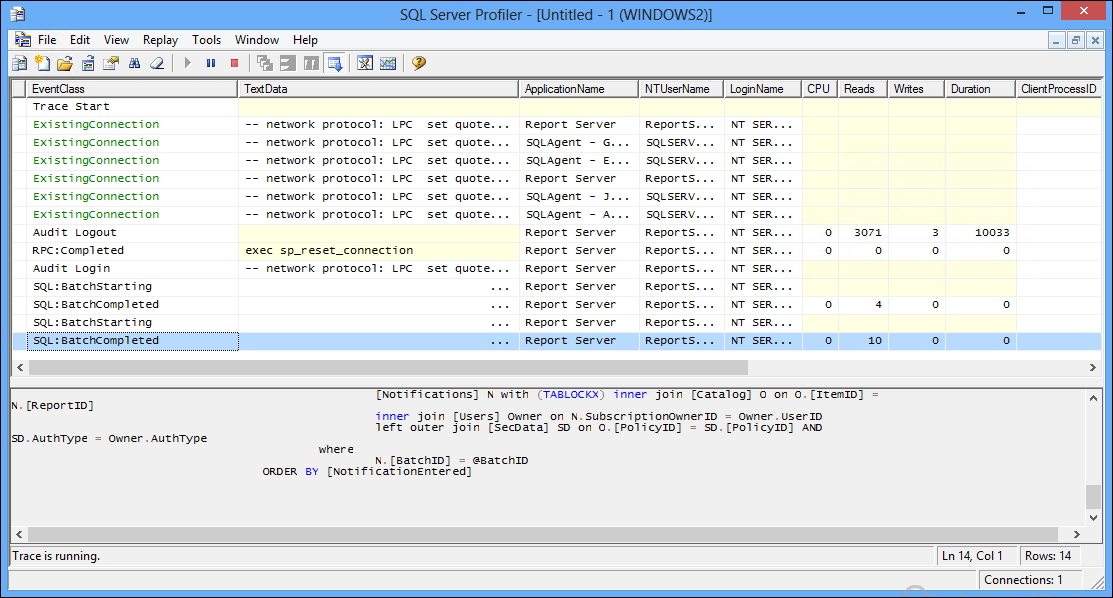
Figure Representing Window of SQL Server Profiler
Configuring A New Trace
After successfully launching the SQL server profiler, initially one will create a new trace (if there does not exist any trace for analysis). Hence, to do so go through following set of steps and configure a new trace:
-
- Go to File option on profiler window and then choose New Trace option from the displayed menu
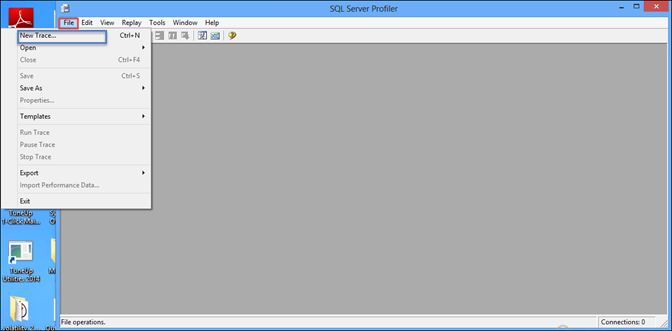
TIP: You can directly press Ctrl + N from keyboard on SQL Server profiler window to perform Step 1
-
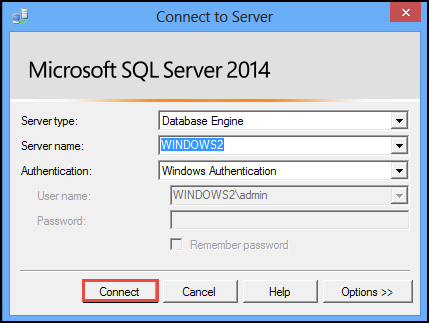
- A Connect to Server window will appear, which enables user to connect with the server. Click on Connect button for establishing the server connection
-
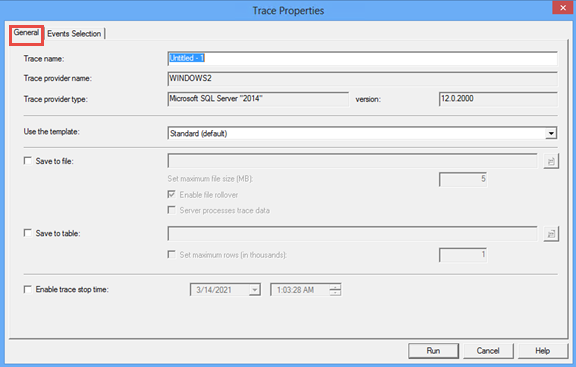
- Now a Trace Properties window will appear in front of you. From this window go to General tab, mention the name of trace in Trace name text box and make no other changes that are filled by default.
-
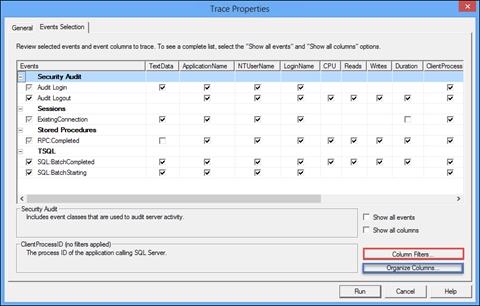
- Navigate to next tab of trace properties windows i.e., Event Selection. This tab allow you to take preview of selected trace and one can check the checkbox of Show all events and Show all columns option to see the detailed structure of trace.
There are two more options available within this tab i.e., Column Filters and Organise Columns
-
-
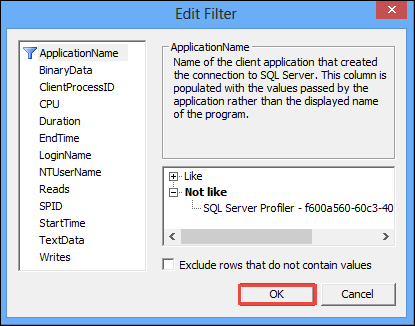
- Column Filters: With help of this button, you can filter more data to be captured. After completing your filtering work, click on OK button to close the Edit Filter window and save the changes
-
-
-
- Organize Columns: It is used to organize and group the columns. Click on OK button after finishing up with all your functioning
-
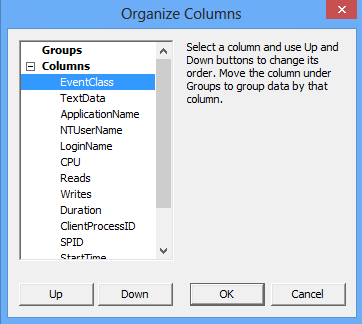
NOTE: Once the trace collection procedure gets started, no changes like grouping and ordering, can be performed within the column
-
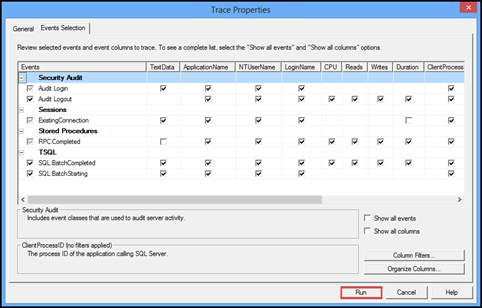
- Click on Run button in order to accomplish your tasks within the server
-
- Finally, you will be able to monitor the server information in a tabular form with different attributes. From the bottom of the profiler window, you will now be able to see whether trace is running or not.
Conclusion
The blog gives a brief introduction about SQL server profiler with its role in the server. Here, user can find ways to perform common operation on SQL server profiler.